Table of Contents
About This Report
This report leverages detailed data from the portfolios of Phoenix Mills and Nexus Malls - two of India’s largest mall developers - to decode the dynamics of India’s organised retail real estate. Together, these portfolios span over 21.4 million sq. ft. across 28 malls in metros and Tier-2/3 cities, providing a representative lens into how modern retail space is evolving. The study benchmarks malls on scale, tenant sales, footfalls, rentals, growth, and developer share, drawing on disclosures from Phoenix Mills, Nexus Malls, and proprietary Datum analytics.
Mega-Malls Driving Half of Organized Retail GLA
The combined portfolio of Phoenix Mills and Nexus Malls spans a total of 21.4 million sq. ft. across 28 malls in FY25. Within this portfolio, scale is heavily concentrated in mega malls - with 9 properties exceeding 1.0 million sq. ft., together accounting for nearly 48% of total leasable area.
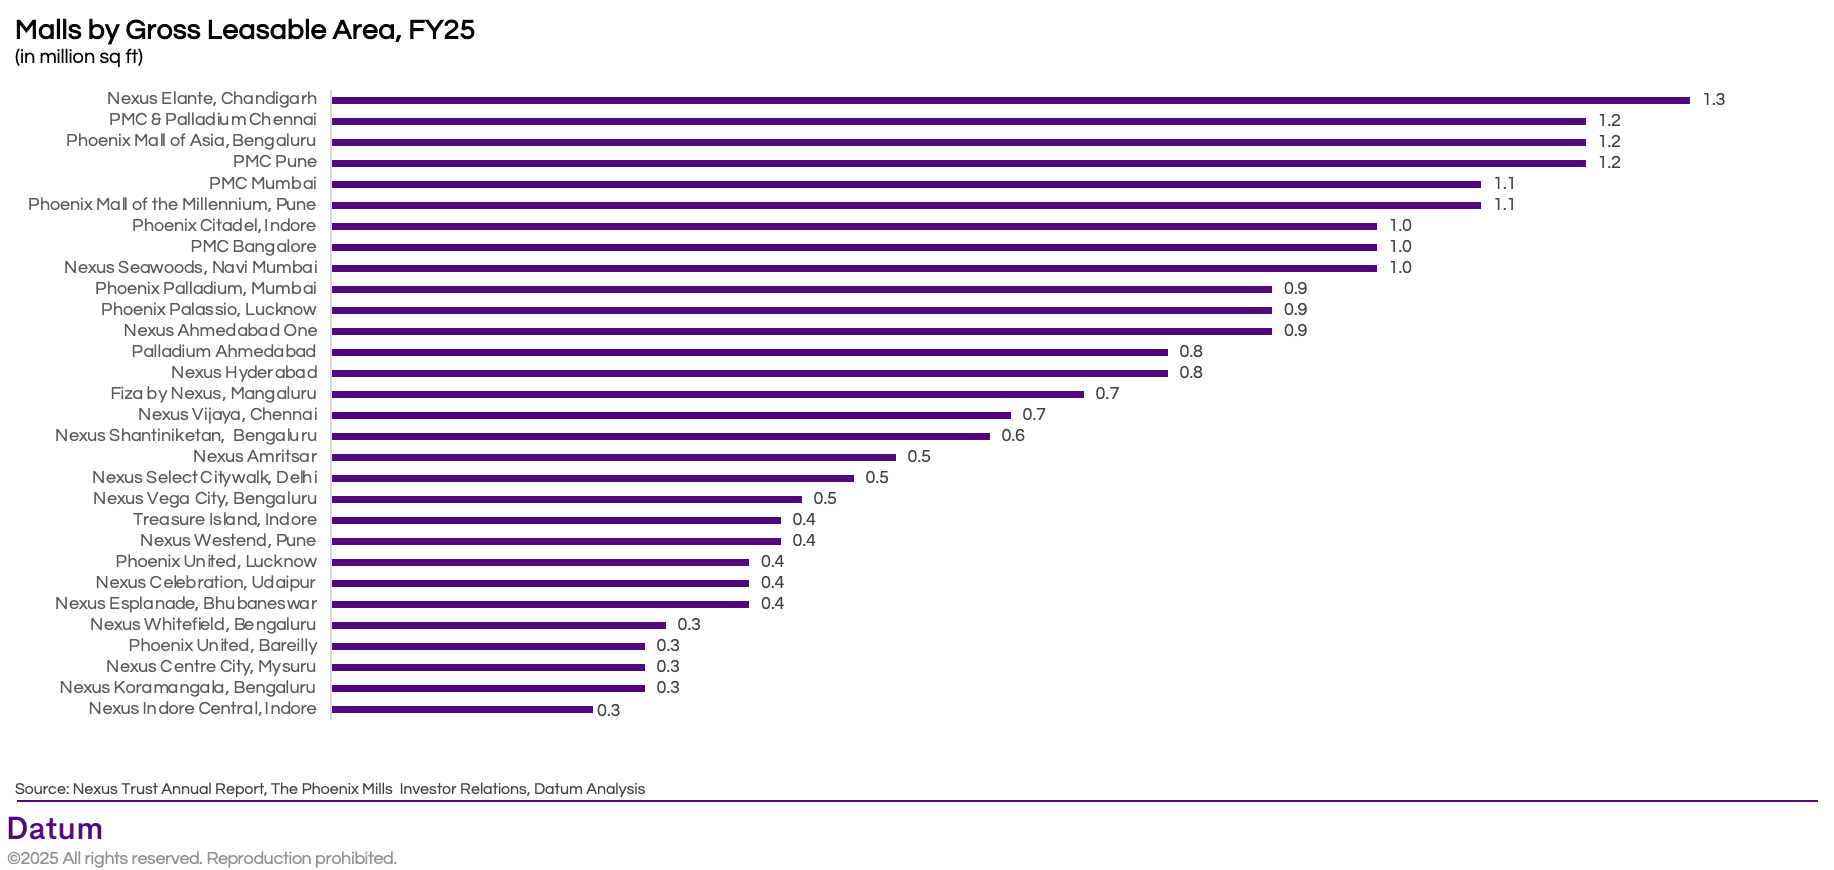
- Tier-2 Cities Join the Mega League. Importantly, mega malls are not just a metro story. Indore, Lucknow, and Chandigarh now host 1 mn+ sq. ft. malls, formats that once were exclusive to Mumbai, Delhi, and Bengaluru. This highlights how Phoenix and Nexus are shaping Tier-2 cities into new consumption hubs.
- Regional Anchors Remain Critical. At the same time, ~19 malls in the 0.3-0.9 mn sq. ft. range continue to play the role of regional anchors. Strategically, developers are betting on fewer, larger assets in metros, while Tier-2/3 expansions provide growth via smaller but fast-scaling catchments.
Tenant Sales: Concentration at the Top, But Tier-2/3 Rising
Annual tenant sales across the Phoenix–Nexus portfolio highlight both the dominance of metro assets and the emergence of regional challengers. In FY25, just five malls - Phoenix Palladium Mumbai, PMC Bengaluru, Select Citywalk Delhi, Nexus Elante Chandigarh, and PMC Pune - generated ₹9,341 crore in sales, accounting for nearly 30% of the portfolio total.
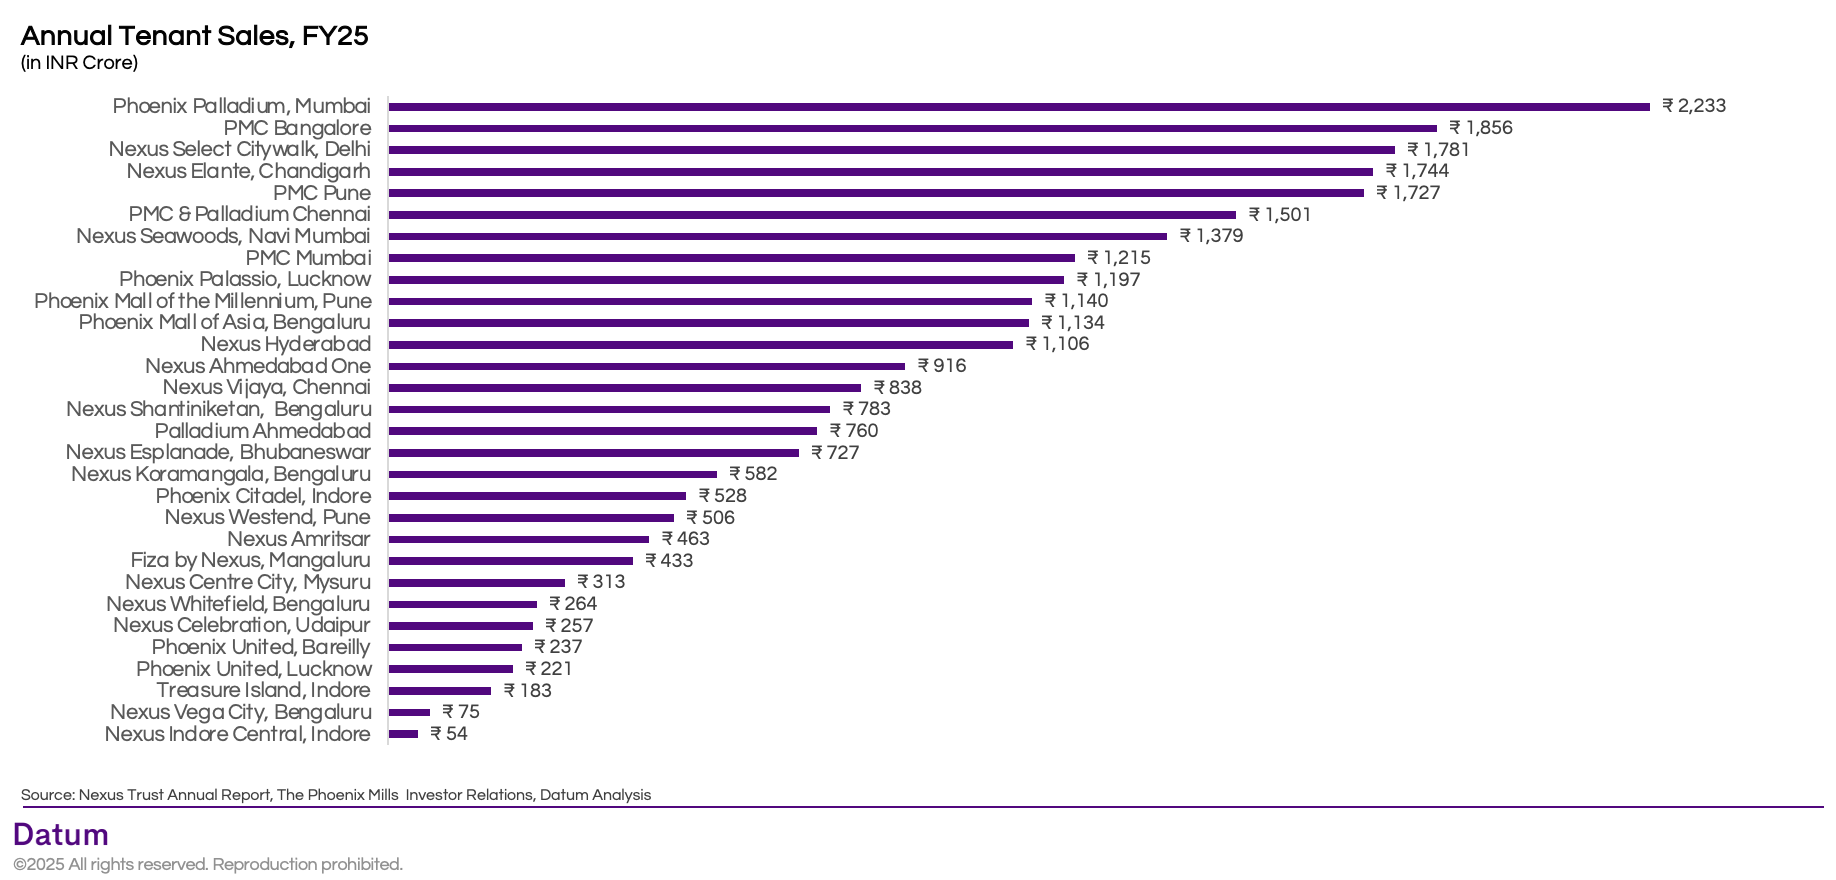
Phoenix’s dominance is evident, with its assets in Mumbai, Pune, Chennai, Bengaluru, Indore, and Lucknow making up six of the top 10 malls by sales. These malls are deeply embedded in India’s consumption hubs and continue to attract both premium brands and high-spending consumers.
At the city level, metros remain the undisputed anchors. Mumbai, Delhi, Bengaluru, Pune, and Chennai each host malls generating over ₹1,700 crore annually, underscoring the structural pull of India’s largest consumption markets.
Yet, the story is not limited to metros. Tier-2 and Tier-3 cities are carving their place in the portfolio’s revenue mix. Phoenix Citadel Indore, Nexus Amritsar, and Nexus Esplanade Bhubaneswar are emerging as regional leaders, delivering ₹500–700 crore in annual sales and rivaling mid-sized metro malls.
The data highlights a dual-speed portfolio: mega malls in metros deliver outsized absolute sales, while regional malls in Tier-2/3 cities provide critical penetration into fast-growing catchments. Together, they create a balanced growth engine-metros ensure scale, while Tier-2/3 expands reach and resilience.
YoY Growth: Stabilization in New Assets, Pressure in Older Malls
Growth dynamics across the Phoenix - Nexus portfolio highlight a two-speed recovery. On one end, newly launched mega malls are posting extraordinary gains as they stabilize post-opening. On the other, several older malls are showing signs of maturity and saturation.
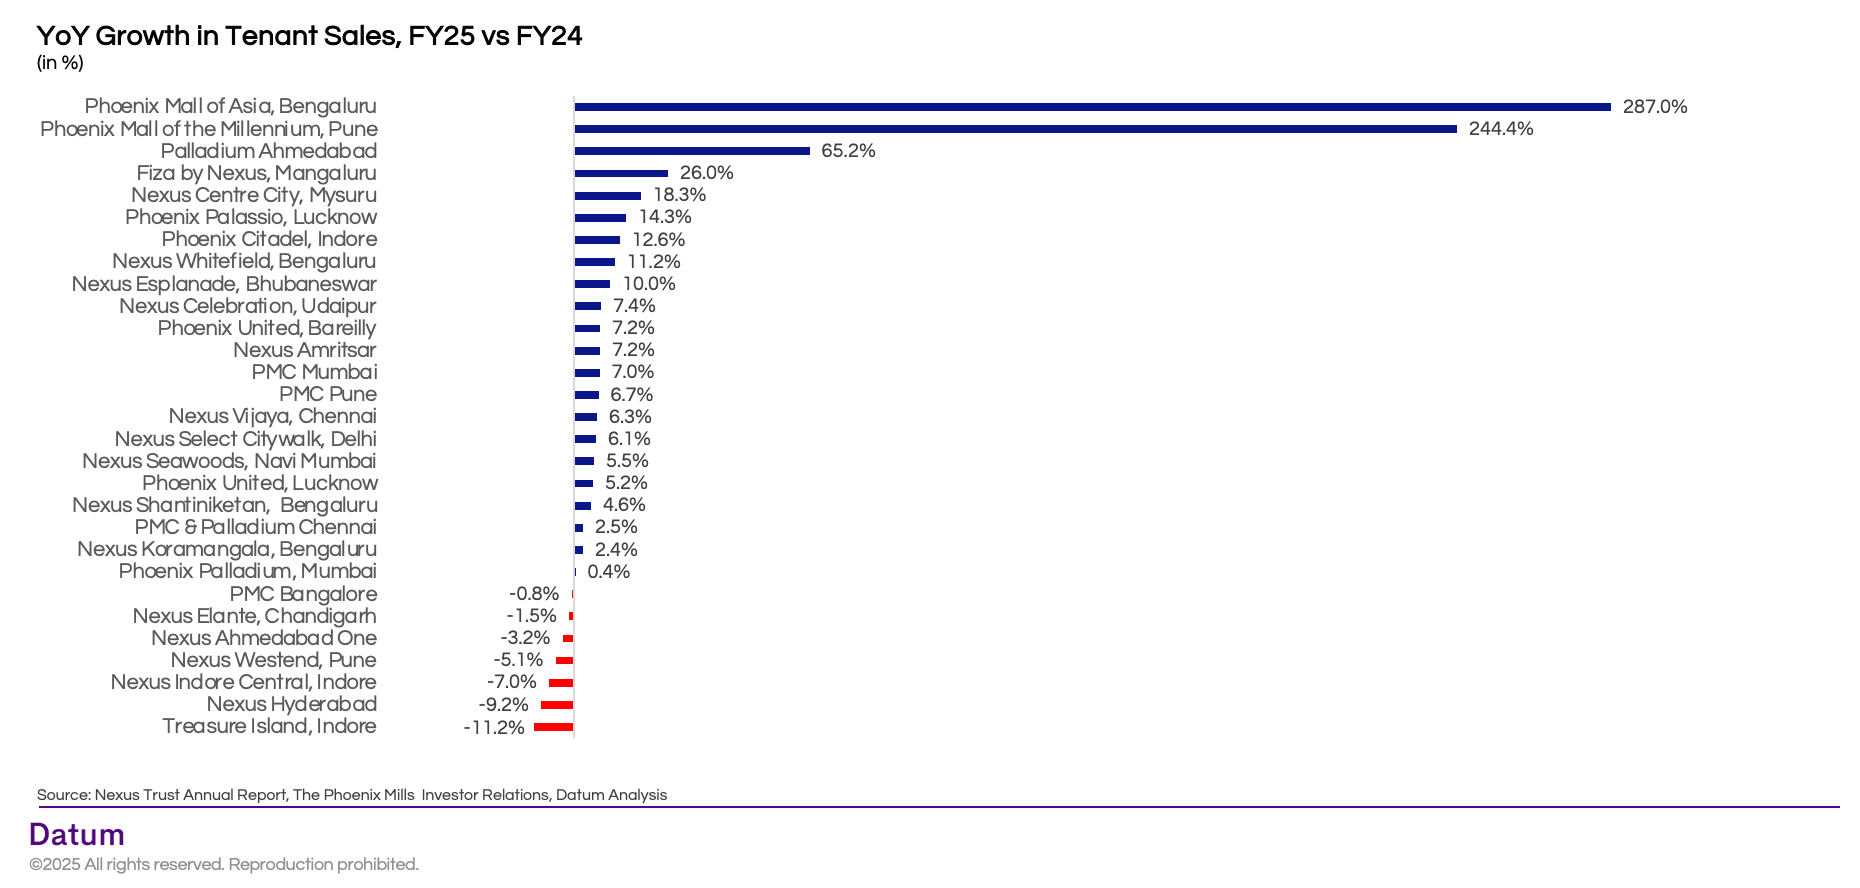
- Breakout performers:
- Phoenix Mall of Asia (Bengaluru, +287%) and Phoenix Mall of the Millennium (Pune, +244%) posted exceptional growth, reflecting their first full year of stabilization after launch.
- Palladium Ahmedabad (+65%) and Fiza by Nexus, Mangaluru (+26%) also recorded strong double-digit growth.
- Tier-2 cities like Mysuru, Lucknow, and Indore registered healthy 12-18% growth, underlining the role of regional consumption hubs.
- Stable metros: Mature assets in metros showed low but steady single-digit growth, such as Select Citywalk Delhi (+6%), PMC Pune (+7%), and PMC Mumbai (+7%). These malls continue to deliver at scale but face natural growth plateaus.
- Weak spots: Several malls saw negative growth, including Treasure Island Indore (-11%), Nexus Hyderabad (-9%), Nexus Indore Central (-7%), and PMC Bangalore (-0.8%). These reflect a mix of competitive pressures, tenant churn, or demand softness in select markets.
Overall, the YoY picture suggests that newer malls are the growth engine, driving outsized percentage gains, while older, stabilized malls remain dependable cash cows but with limited upside.
Footfall: Ticket Sizes Drive Sales as Visitor Volumes Flatten
While tenant sales have grown across much of the Nexus portfolio, the underlying footfall trends tell a different story. In FY25, more than 70% of malls reported flat-to-negative traffic growth, suggesting that sales momentum is increasingly being driven by higher ticket sizes rather than rising visitor counts.
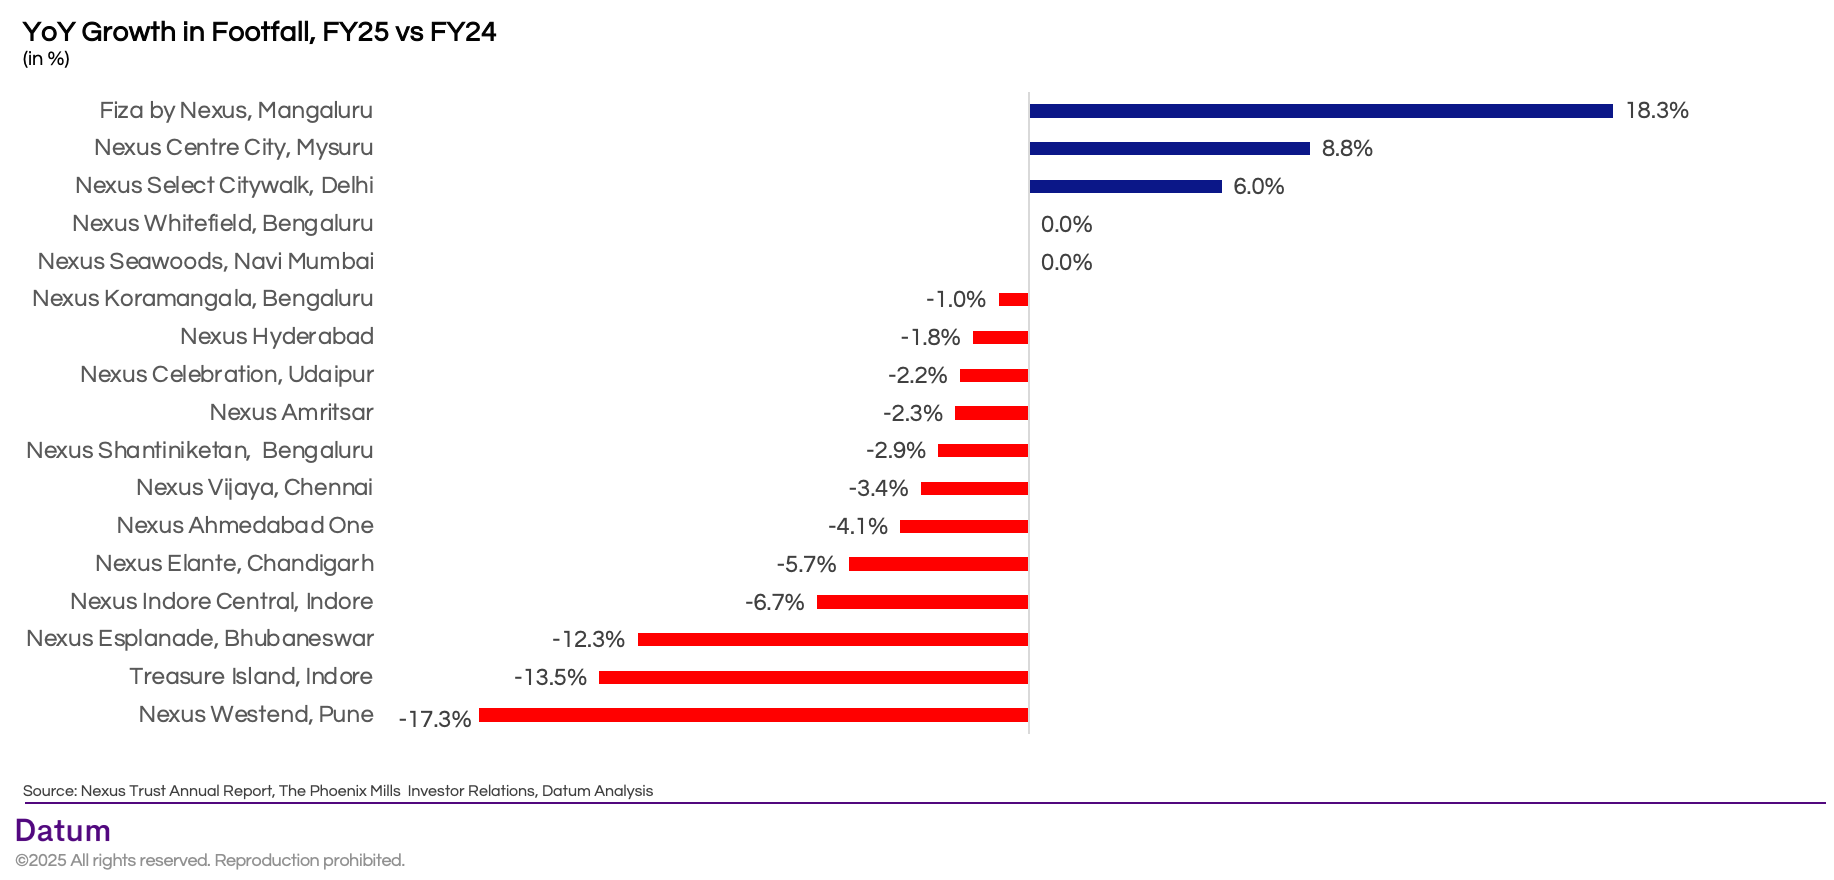
- Tier-2 outperformers lead footfall growth:
- Fiza by Nexus, Mangaluru (+18.3%) and Nexus Centre City, Mysuru (+8.8%) are the only malls to post double-digit growth, reflecting their growing catchment importance in Tier-2 markets.
- Premium icon holds steady:
- Select Citywalk, Delhi (+6.0%) managed positive growth, underlining its position as a differentiated premium metro destination.
- Widespread stagnation in Tier-1 hubs:
- Large, mature assets in metros such as Bengaluru, Navi Mumbai, Hyderabad, and Chennai recorded 0 to -4% footfall change, pointing to saturation.
- Decliners in Tier-2/3:
- Sharp drops were visible in Nexus Westend Pune (-17.3%), Treasure Island Indore (-13.5%), and Nexus Esplanade Bhubaneswar (-12.3%), highlighting stress in certain regional markets.
Overall, the contrast is clear: sales are rising on ticket size, not visitor volume. Nexus’ footfall growth is skewed towards Tier-2 outperformers and a single premium metro asset, while most Tier-1 hubs remain flat or in decline.
Rentals: Premium Metros Command a Clear Pricing Power
The Phoenix–Nexus portfolio’s rental structure highlights the clear divide between premium metros and regional markets.
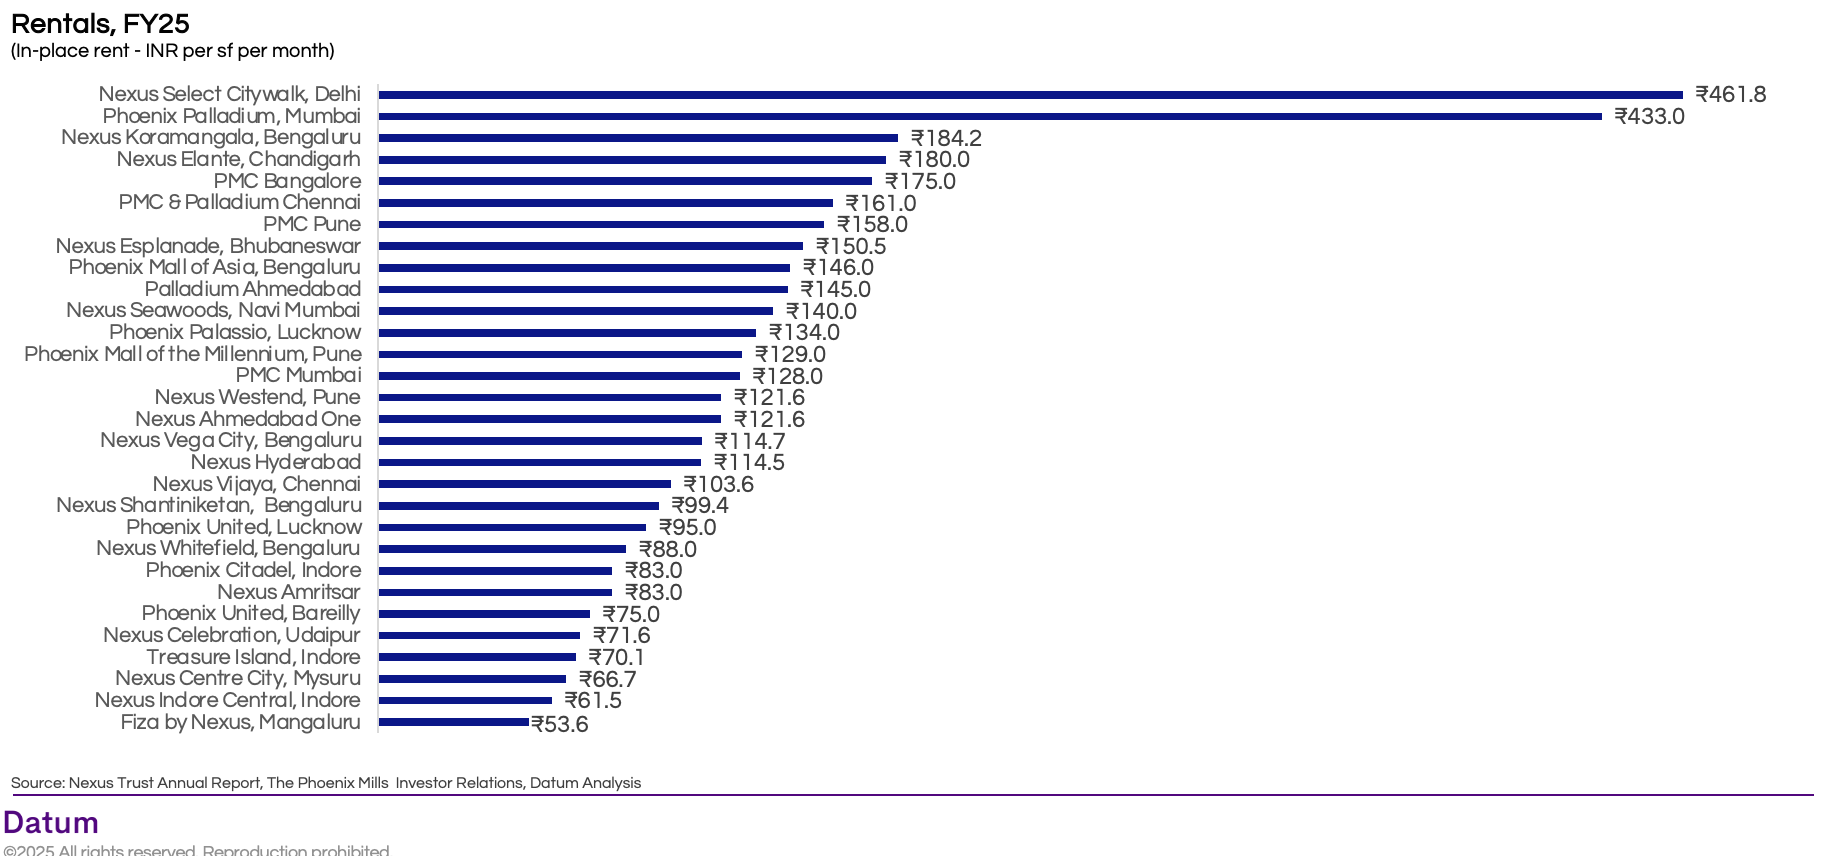
- Metro icons dominate pricing:
- Select Citywalk Delhi (₹462/sq. ft./month) and Phoenix Palladium Mumbai (₹433/sq. ft./month) are the most expensive malls in India, reflecting their positioning as luxury retail destinations with strong brand pull.
- Other metro hubs like Nexus Koramangala Bengaluru (₹184), Nexus Elante Chandigarh (₹180), and PMC Bangalore (₹175) remain in the top tier, commanding high rents well above ₹150/sq. ft./month.
- Mid-tier metro assets:
- Chennai, Pune, Navi Mumbai, and Hyderabad malls cluster in the ₹120–150 range, balancing scale with affordability for mainstream brands.
- Tier-2 affordability:
- Regional centers like Nexus Amritsar (₹83), Phoenix United Bareilly (₹75), Nexus Celebration Udaipur (₹72), and Treasure Island Indore (₹70) offer competitive rentals, supporting retailer expansion in smaller but fast-growing catchments.
- Fiza by Nexus Mangaluru (₹54) and Nexus Indore Central (₹62) are the most affordable in the portfolio.
The data makes one thing clear: metros anchor profitability through premium rents, while Tier-2/3 malls provide expansion opportunities through affordable rentals. This dual strategy helps balance the portfolio between yield maximization and market penetration.
Rental Growth: Tier-2 Malls Outperform, Premium Assets Correct
The rental dynamics across Phoenix and Nexus portfolios in FY25 highlight a divergence between Tier-2 growth and metro corrections.
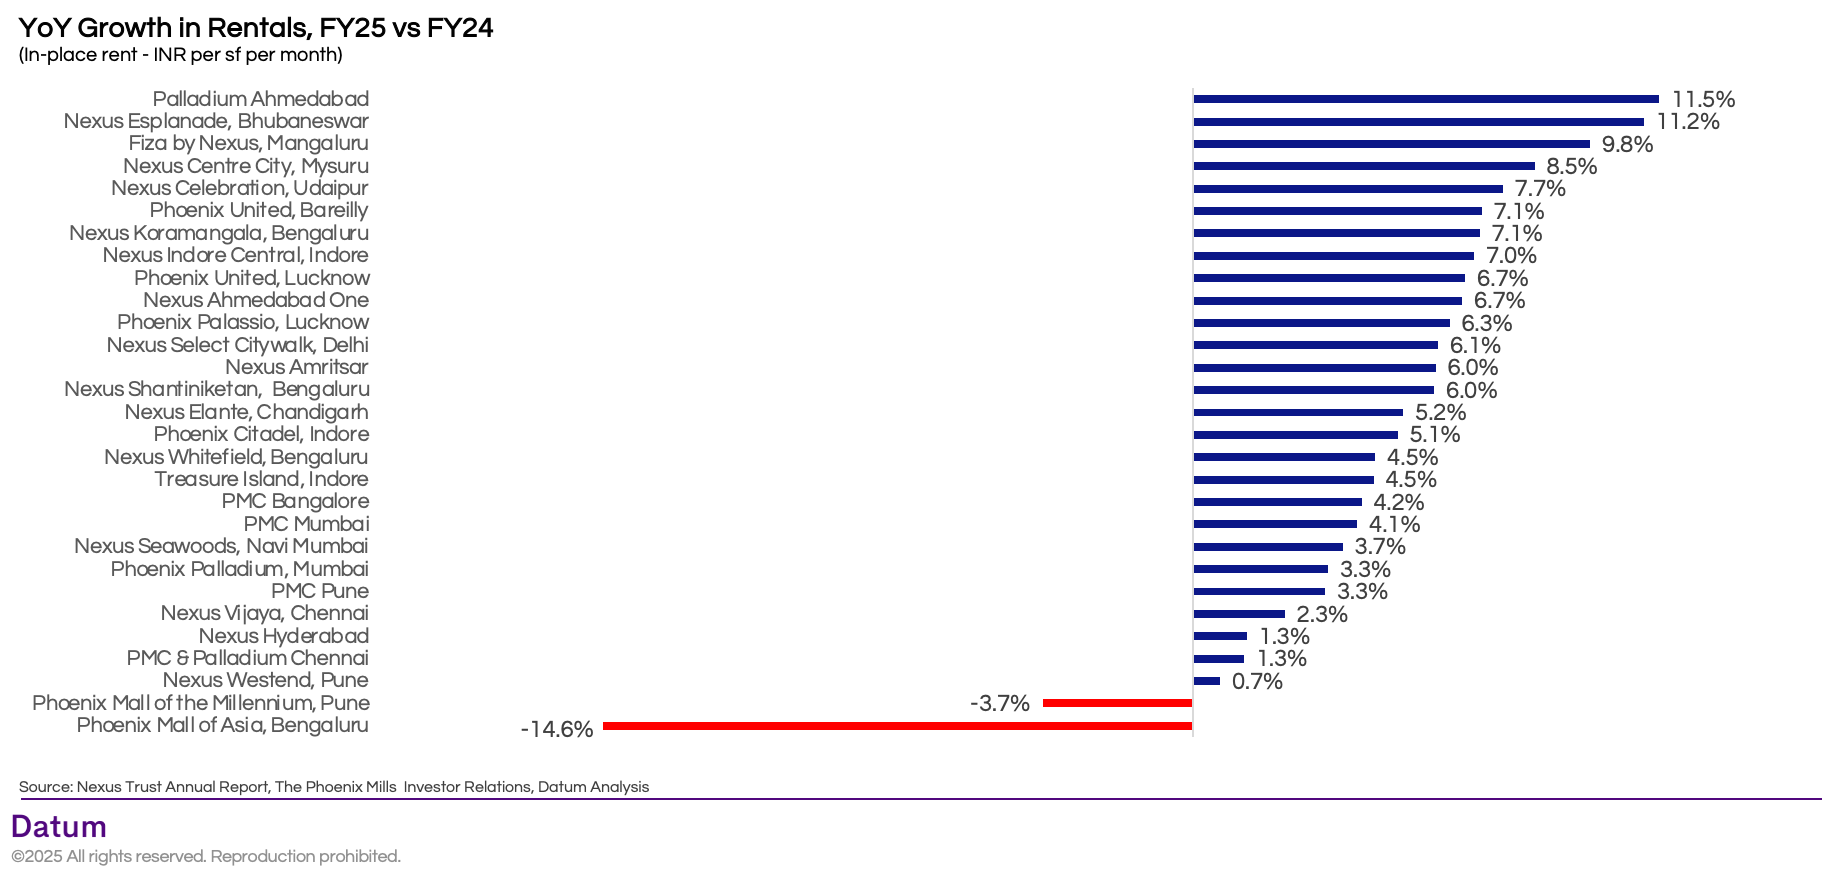
- Tier-2 and regional outperformers:
- Palladium Ahmedabad (+11.5%), Nexus Esplanade Bhubaneswar (+11.2%), and Fiza by Nexus Mangaluru (+9.8%) led the rental growth charts, showing the ability of regional malls to steadily push rents as demand expands.
- Other regional assets like Mysuru (+8.5%), Udaipur (+7.7%), and Bareilly (+7.1%) also posted strong mid-to-high single-digit growth.
- Steady metros:
- Mature but resilient assets such as Select Citywalk Delhi (+6.1%), Nexus Koramangala Bengaluru (+7.0%), and PMC Mumbai (+4.1%) reflect stable but moderate rent escalations.
- Corrections in premium metros:
- Phoenix Mall of Asia Bengaluru (-14.6%) and Phoenix Mall of the Millennium Pune (-3.7%) saw rental corrections, reflecting post-launch adjustments as landlords balance occupancy with tenant affordability.
- This correction indicates that hyper-premium rent levels may not be sustainable immediately post-launchand could take time to stabilize.
- Overall trend:
- Tier-2/3 markets are gaining pricing power, while newly launched mega-malls in metros are recalibrating.
- This mix highlights a dual-speed market: metros drive absolute rental highs, but Tier-2 cities increasingly drive rental growth momentum.
Metro vs. Tier-2/3: Summary of Findings
A tier-wise cut of the Phoenix–Nexus portfolio reveals the concentration of scale and consumption in metros, even as Tier-2/3 cities emerge as growth frontiers:
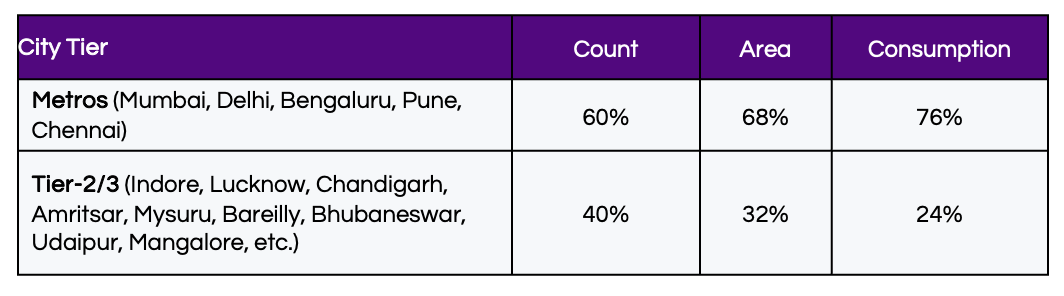
- Mall count: Metros (Mumbai, Delhi NCR, Bengaluru, Pune, Chennai) account for 60% of malls, while Tier-2/3 cities (Indore, Lucknow, Chandigarh, Amritsar, Mysuru, Bareilly, Bhubaneswar, Udaipur, Mangaluru, etc.) make up 40%.
- Gross Leasable Area (GLA): The split is even more skewed, with metros contributing 68% of total GLA, reflecting their dominance in mega-mall formats, versus 32% for Tier-2/3.
- Consumption (Tenant Sales): Metros drive 76% of consumption, leaving 24% for Tier-2/3, underlining the disparity in spending power, retail depth, and footfall monetisation.
In essence: metros remain the profit and productivity engines of the portfolio, with higher trading densities and premium positioning. Tier-2/3, while smaller in absolute terms, are the strategic expansion markets where developers are building presence to capture long-term growth.
Key Outcomes for Brands Looking to Expand
India’s mall market is no longer metro-only. To capture future growth, brands must follow a “barbell strategy”- Premium visibility in metros + first-mover advantage in Tier-2/3.
- Metros = Scale, Tier-2/3 = Growth Frontier
- Metros remain the revenue powerhouses (76% of consumption), ideal for flagship stores, premium positioning, and omnichannel brand presence.
- Tier-2/3 malls, though smaller, are outperforming in growth rates (Mysuru, Mangaluru, Indore), making them strategic entry points for capturing rising aspirational demand.
- Mega Malls Drive Visibility
- Large malls (>1 mn sq. ft.) are magnets for both consumers and brands, with higher footfalls and better tenant sales performance.
- Brands seeking maximum visibility and higher sales per sq. ft. should prioritize presence in these assets.
- Rental Economics Differ Sharply
- Premium metros like Delhi (Select Citywalk) and Mumbai (Palladium) command ₹400–460/sf rents, viable for luxury, beauty, and high-margin categories.
- Tier-2/3 malls operate at sub-₹100/sf, lowering entry barriers for value and mid-market brands.
- Sales Growth Isn’t Always Footfall-Driven
- 70% of malls showed flat or negative traffic growth, but sales rose on the back of higher ticket sizes.
- For brands, this means AOV (Average Order Value) is increasing, especially in metros—premiumization and upselling strategies are key.
- Regional Anchors Emerging
- Properties like Phoenix Citadel (Indore), Nexus Esplanade (Bhubaneswar), and Nexus Celebration (Udaipur) are establishing themselves as regional consumption hubs with ₹500–700 Cr annual sales.
- Brands expanding into non-metros should target these anchor malls first to consolidate presence.
If you are a brand looking to expand and want data-backed insights to plan your retail strategy, reach out to us at Datum Intelligence. Our sector-specific research and store-level data can help you identify the right malls, cities, and formats for sustainable growth.
Write to us at hello@datumintell.com