The Power of Few: How Just 18% of Brands Drive 80% of Blinkit's Sales
A closer look at how a small fraction of brands and categories drive the majority of Blinkit's revenue, highlighting key patterns in customer spending

Related

Trust-Led Reset in Eggs Category
Brand Leadership Compressed Sharply Post Trust Shock on Blinkit
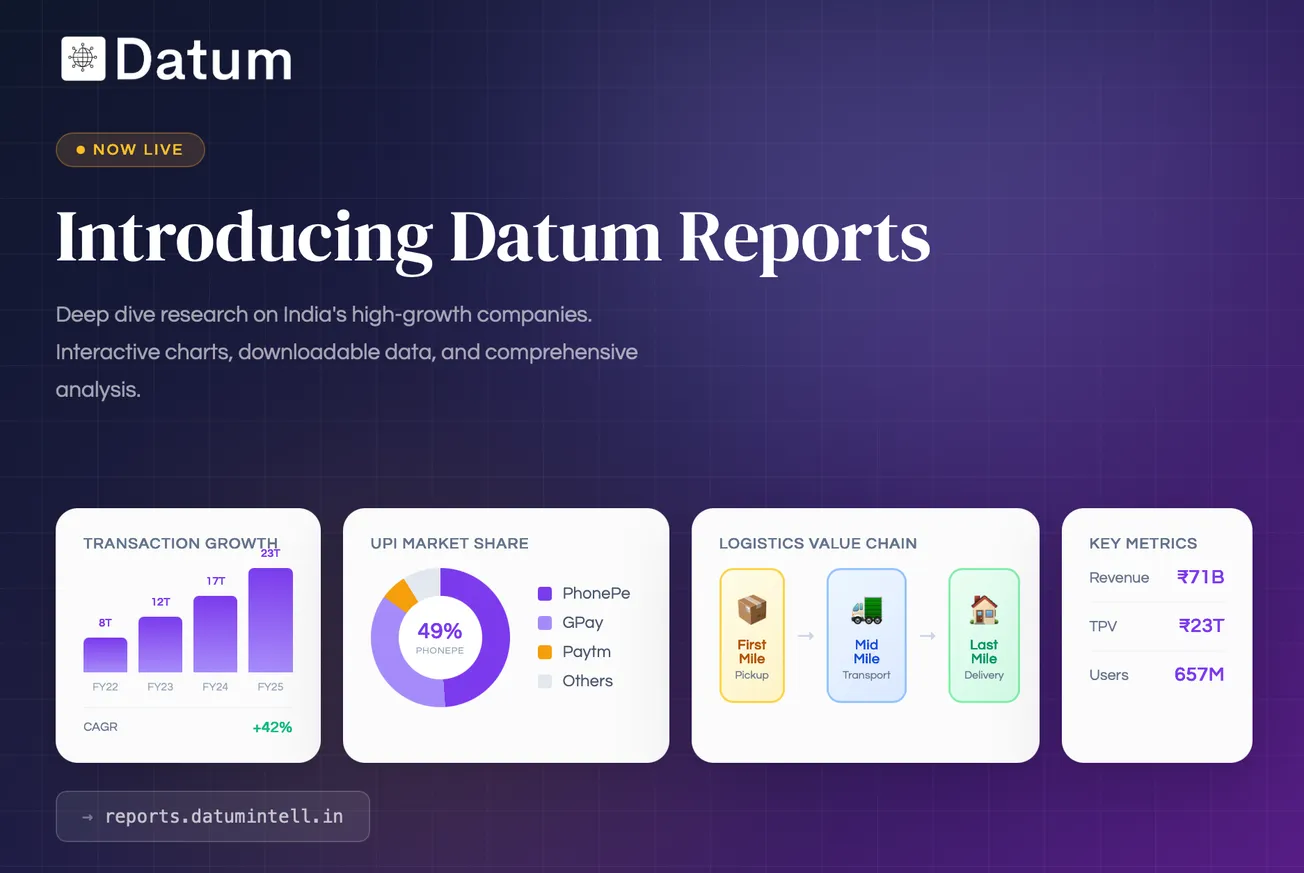
Introducing Datum Reports: Deep Dive Research on India's High-Growth Companies
Datum Reports offers comprehensive, data-driven research on India’s most important technology companies, designed for clarity and decision-making.

Protein-Led Demand Is Reshaping Blinkit's Peanut Butter Category
Blinkit’s peanut butter category is already consolidated. Pintola and MyFitness together control ~73% of sales, showing how quick commerce rapidly rewards scale, recall, and price-pack efficiency over assortment breadth.

Blinkit Data Shows Why Popcorn Has Become a Two-Brand Category
Blinkit’s popcorn category has rapidly consolidated into a two-brand market, with 4700BC and Act II controlling ~99% of sales, leaving virtually no competitive long tail.
Latest
Trust-Led Reset in Eggs Category
Brand Leadership Compressed Sharply Post Trust Shock on Blinkit
Introducing Datum Reports: Deep Dive Research on India's High-Growth Companies
Datum Reports offers comprehensive, data-driven research on India’s most important technology companies, designed for clarity and decision-making.
Protein-Led Demand Is Reshaping Blinkit's Peanut Butter Category
Blinkit’s peanut butter category is already consolidated. Pintola and MyFitness together control ~73% of sales, showing how quick commerce rapidly rewards scale, recall, and price-pack efficiency over assortment breadth.
Blinkit Data Shows Why Popcorn Has Become a Two-Brand Category
Blinkit’s popcorn category has rapidly consolidated into a two-brand market, with 4700BC and Act II controlling ~99% of sales, leaving virtually no competitive long tail.