Table of Contents
UPI (Unified Payments Interface) has transformed how India transacts, becoming the country’s default digital payment method across both urban and rural markets. With over 12.3 billion transactions valued at ₹7.34 lakh crore in the period analyzed, UPI is no longer just a payment mode - it’s the backbone of India’s digital commerce ecosystem.
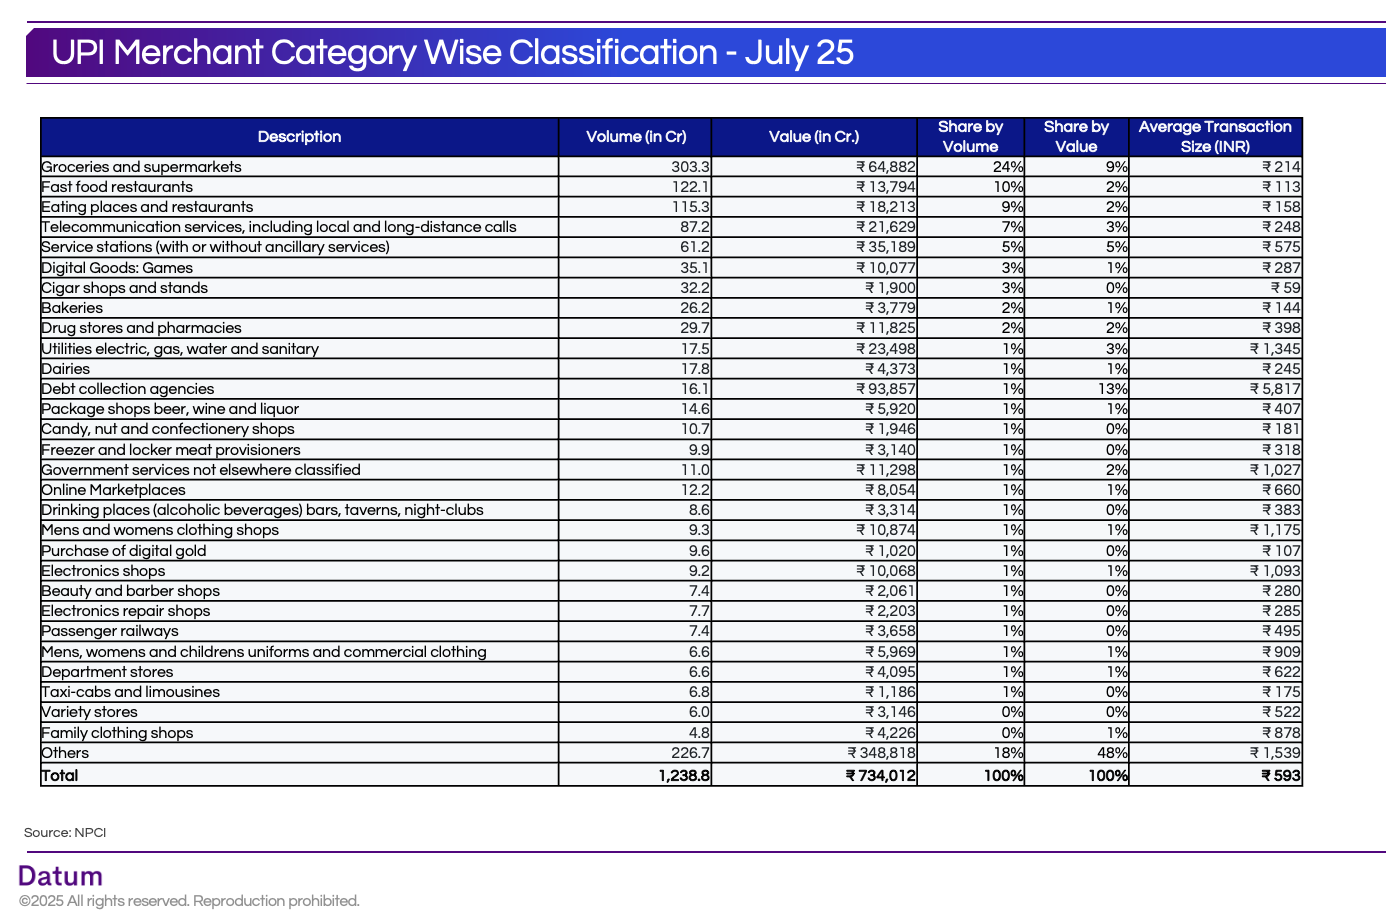
This category-wise breakdown shows how UPI is being used across daily essentials, services, entertainment, and high-value payments, revealing fascinating patterns in how consumers engage with the platform.
Groceries & Supermarkets: Everyday Essentials Dominate
Volume: 3,032.59 million
Value: ₹64,882 crore
Share: 24% of total transactions by volume, 9% by value
Average Ticket Size: ₹214
UPI has firmly replaced cash at kirana stores, supermarkets, and convenience outlets. The low ticket size shows the dominance of small, frequent purchases — exactly where UPI thrives.
Food Services: The Second-Largest UPI Use Case
Fast Food Restaurants: 10% share by volume, ₹113 average ticket size
Eating Places & Restaurants: 9% share by volume, ₹158 average ticket size
Dining, whether quick-service or casual, is a massive driver of UPI usage. The low friction of scanning a QR code at the counter or table has made UPI the go-to payment method across F&B formats.
Telecom Services: Recurring Digital Payments
Volume: 871.88 million
Value: ₹21,629 crore
Average Ticket Size: ₹575
Recharge and bill payments are a natural fit for UPI. Its speed, no-fee structure, and instant confirmation make it ideal for recurring services like mobile plans and broadband.
High-Value, Low-Frequency Categories
While most UPI use cases are high-frequency, some categories see fewer but much higher-value transactions:
Debt Collection Agencies: ₹93,857 crore (13% of total value) with an average ticket size of ₹5,817
Utilities (Electricity, Gas, Water): ₹1,345 per transaction
Government Services: ₹1,027 per transaction
These categories show UPI’s growing role in formal, large-ticket payments that were once dominated by NEFT or cheques.
Digital Goods & Online Marketplaces
Digital Games: ₹287 per transaction, 3% volume share
Online Marketplaces: ₹8,054 crore total value, ₹660 per transaction
The e-commerce ecosystem is deeply tied to UPI adoption. Whether shopping on Amazon, Flipkart, or smaller D2C sites, UPI’s one-tap payments are becoming standard, reducing cart abandonment.
Fashion & Apparel Payments
Men’s & Women’s Clothing Shops: ₹1,175 average ticket size
Family Clothing Shops: ₹878 per transaction
Uniform & Commercial Clothing: ₹909 per transaction
Fashion is emerging as a notable UPI category, reflecting how digital payments have moved into discretionary spending beyond necessities.
The Bigger Picture of UPI Usage
From the macro lens:
- Top Volume Drivers: Groceries, restaurants, telecom, and pharmacies.
- Top Value Drivers: Debt repayment, utilities, government services.
- Frequency Play: Low-ticket categories like food, groceries, and beauty.
- Value Play: High-ticket services like electronics, gold, and government fees.
UPI’s adoption curve is no longer just about urban millennials — it’s mainstream across India’s spending economy. It powers both high-frequency, low-value daily spends and low-frequency, high-value transactions, proving its versatility.
For businesses, UPI data isn’t just about payments — it’s a live pulse check on consumer behavior in India.


